PORTFOLIO - GASCO SALES PORTAL
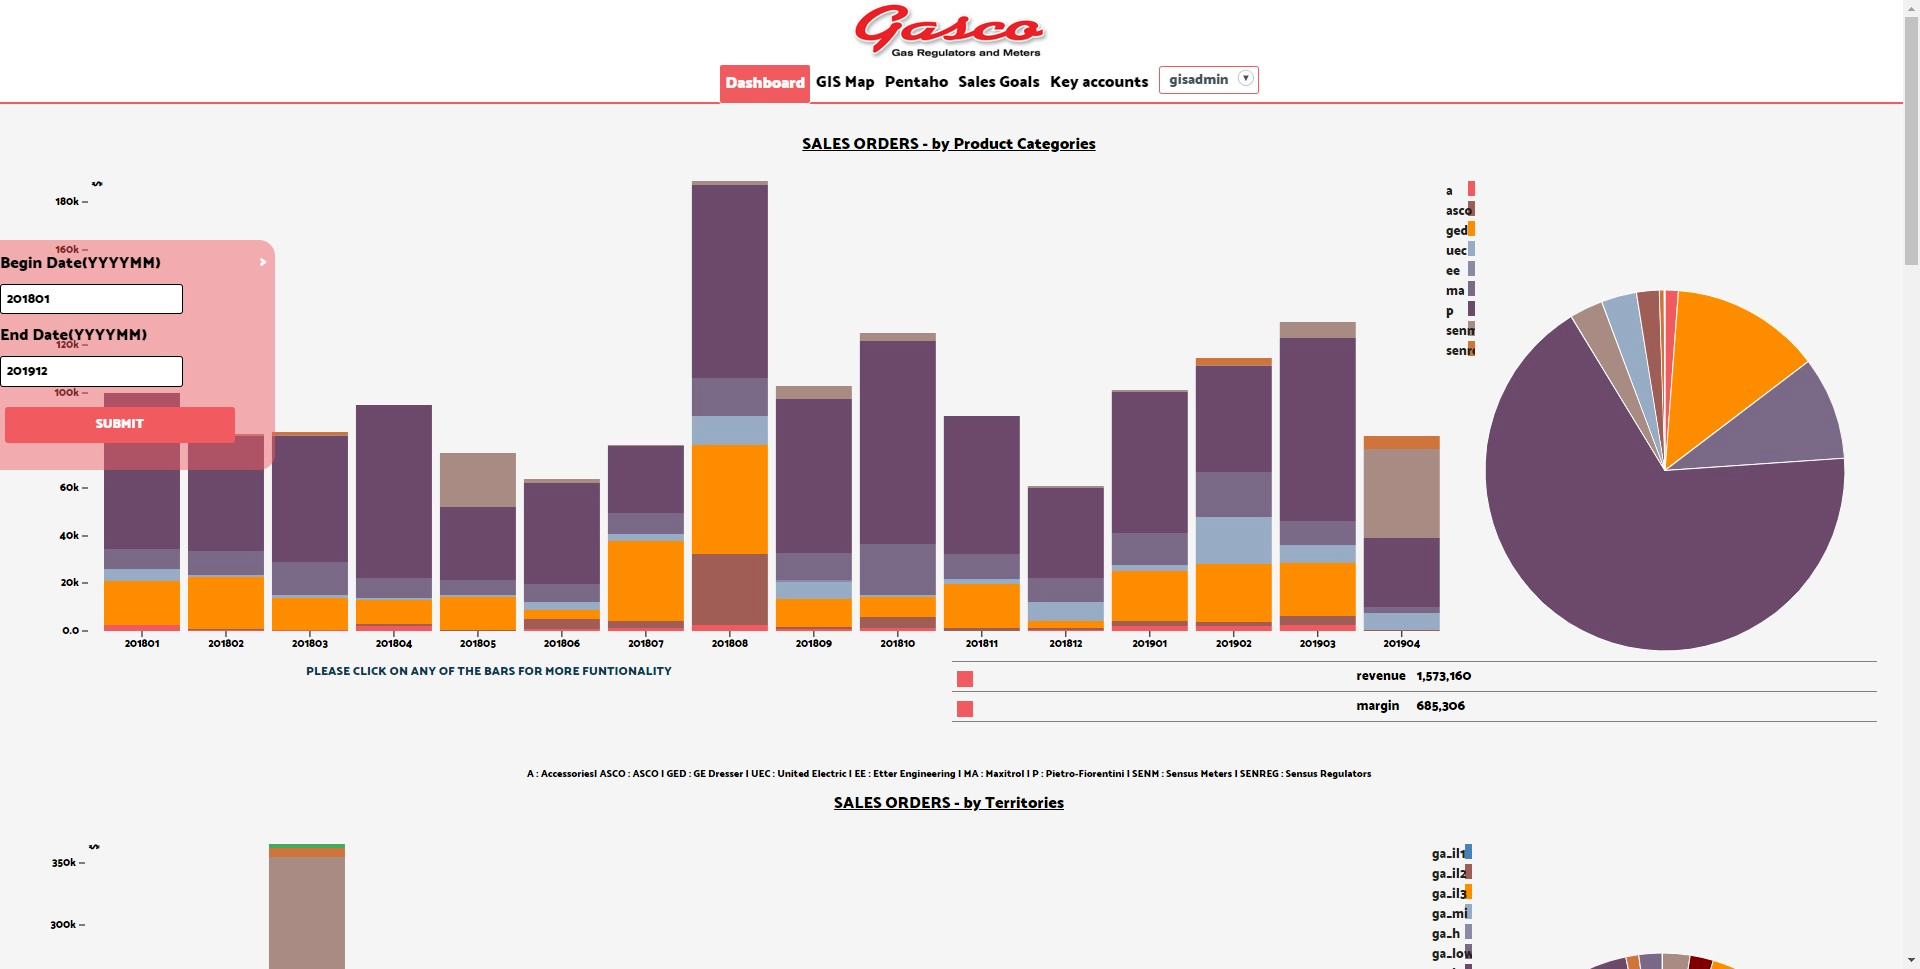
Dashboard Page
When an employee signs into the portal they land on to this dashboard page that gives them an high level look at the company's progress categorized by certain business documents. There is also a filter functionality that enables a historical data search.

Dashboard page
The graphs have interactive functionality that enables a user to click the original graph (from the previous page) and be presented with another graph that has more interactive features to respond to clicks and mouseover hovers.
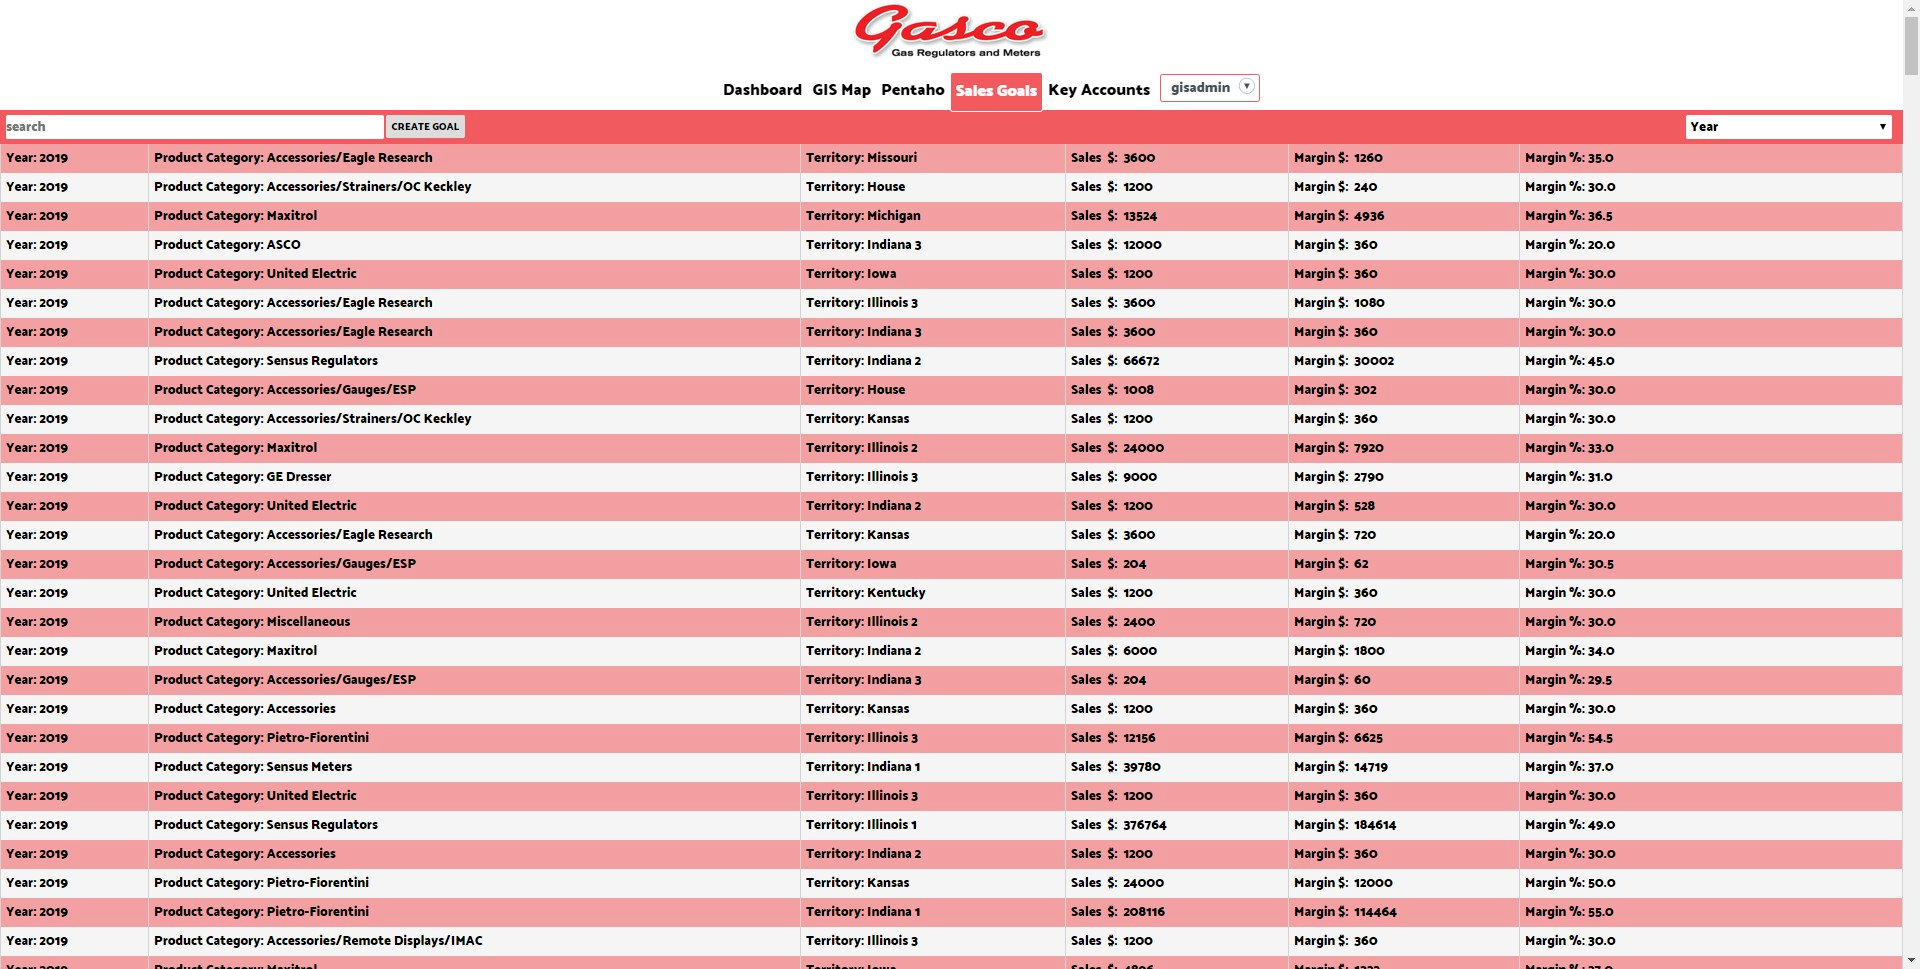
Sales Goal Page
This page allows a user to create sales target goals based on different sales territories and also to filter and search those goals.

Customer Accounts Page
The Customer Accounts page lists all customers that the company has and provides options to select if a customer is a sales target for a particular period or not. It also provides searching and sorting capabilities.
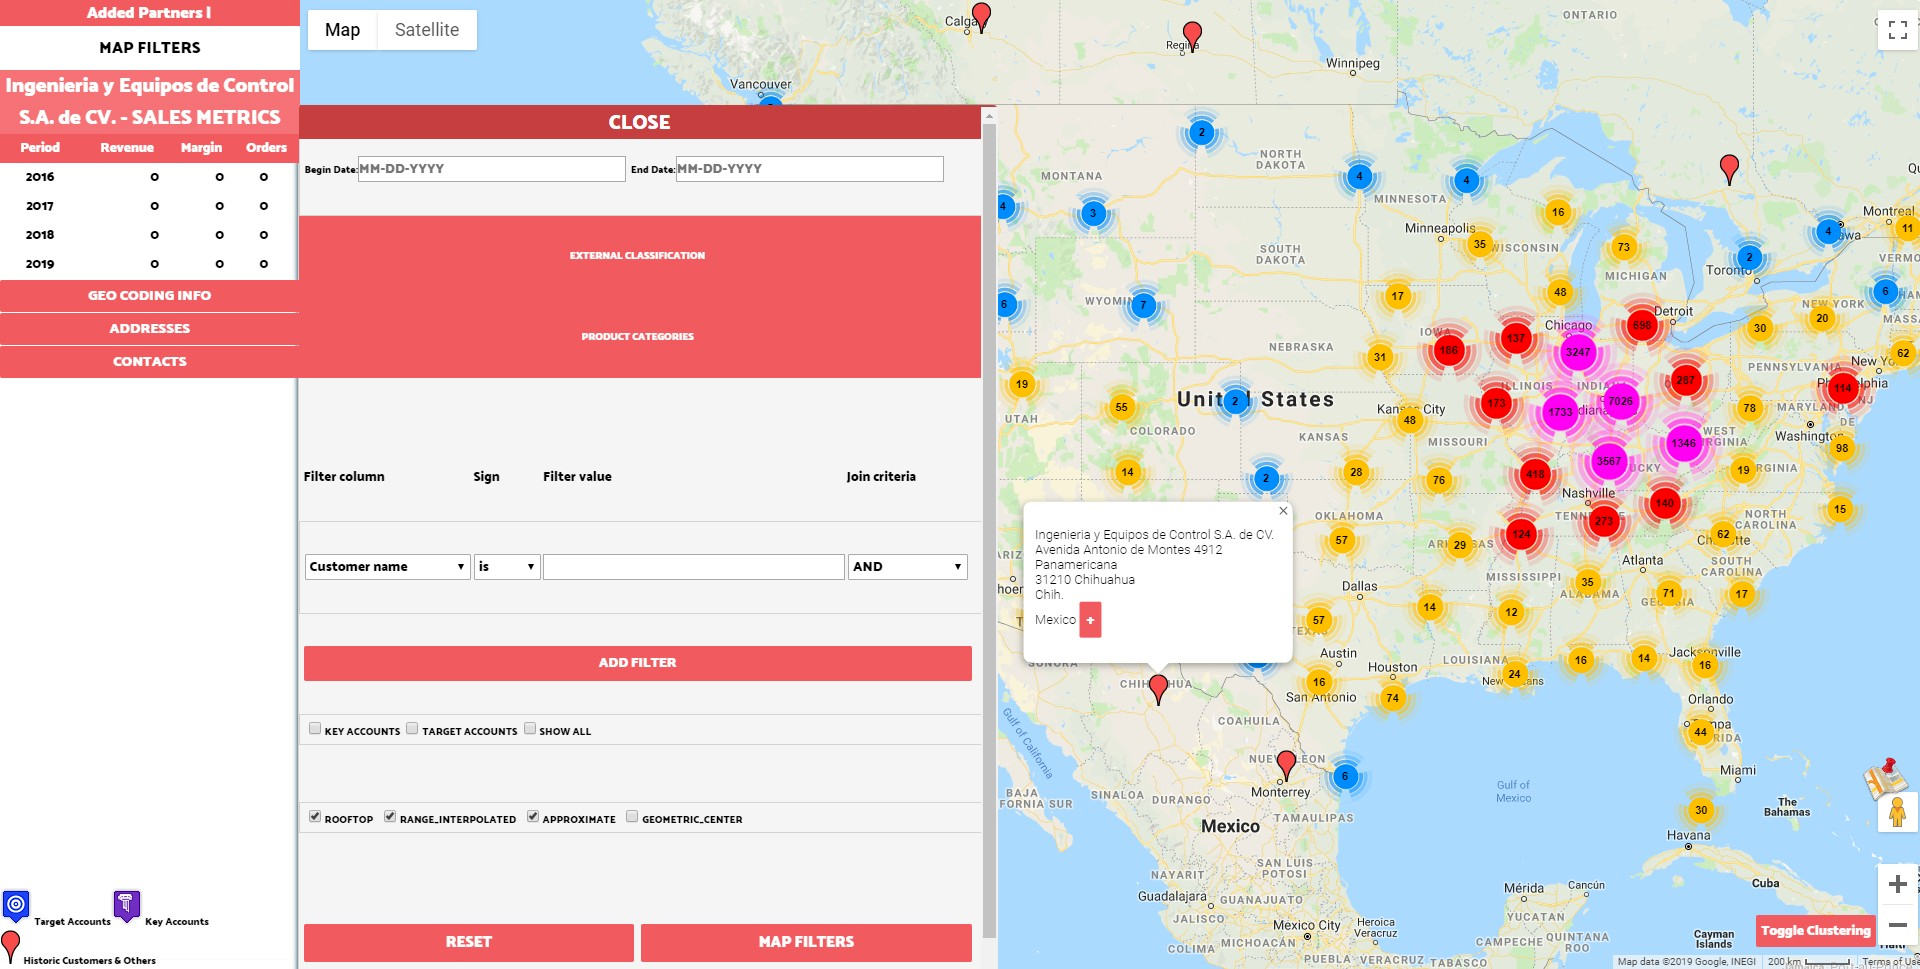
Prospects Map Page
The Prospects map page displays plotted customers by different categorization( target account, key accounts, and historic customers and others) which ties back to sales effort roles assigned on the Customer Accounts page. This page leverages to googleMaps API, Ajax, jQuery and javascript to perform its core functions. On a customer plotted pin a user is able to see the customer's past orders, past paid invoices, and furthermore click the pin for a more detailed look. The right fly out enables filtering by date, classifications, categories, account type, geocoding quality, and by dynamically adding some grouped filters. Last but not least a user can short list the customers that they want to focus on by doubling clicking on a customer plotted pin and by doing so add them to the "Added Partners" cache.
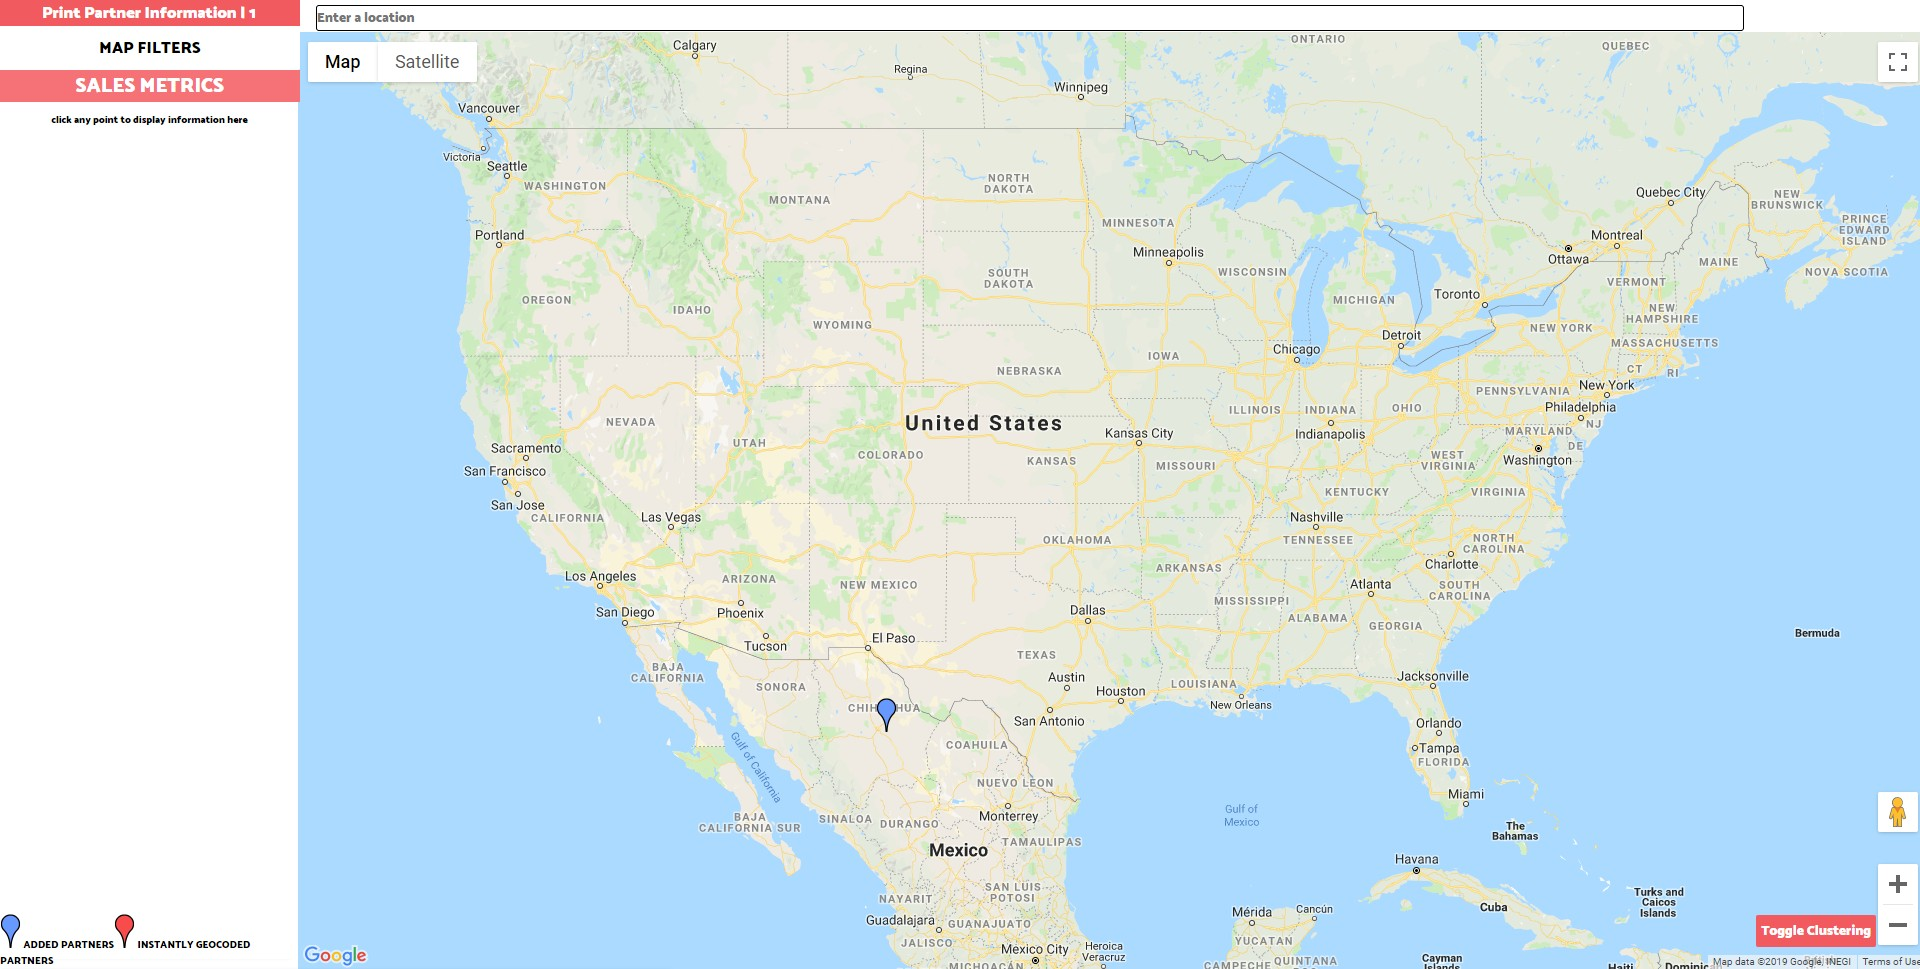
Prospects Maps Page (continued)
The Customizable Map is were the "Added Partners" from the Prospects Map are displayed. On this page a user can search a customer's address straight on to the map and can add all those plotted points to a print cache.
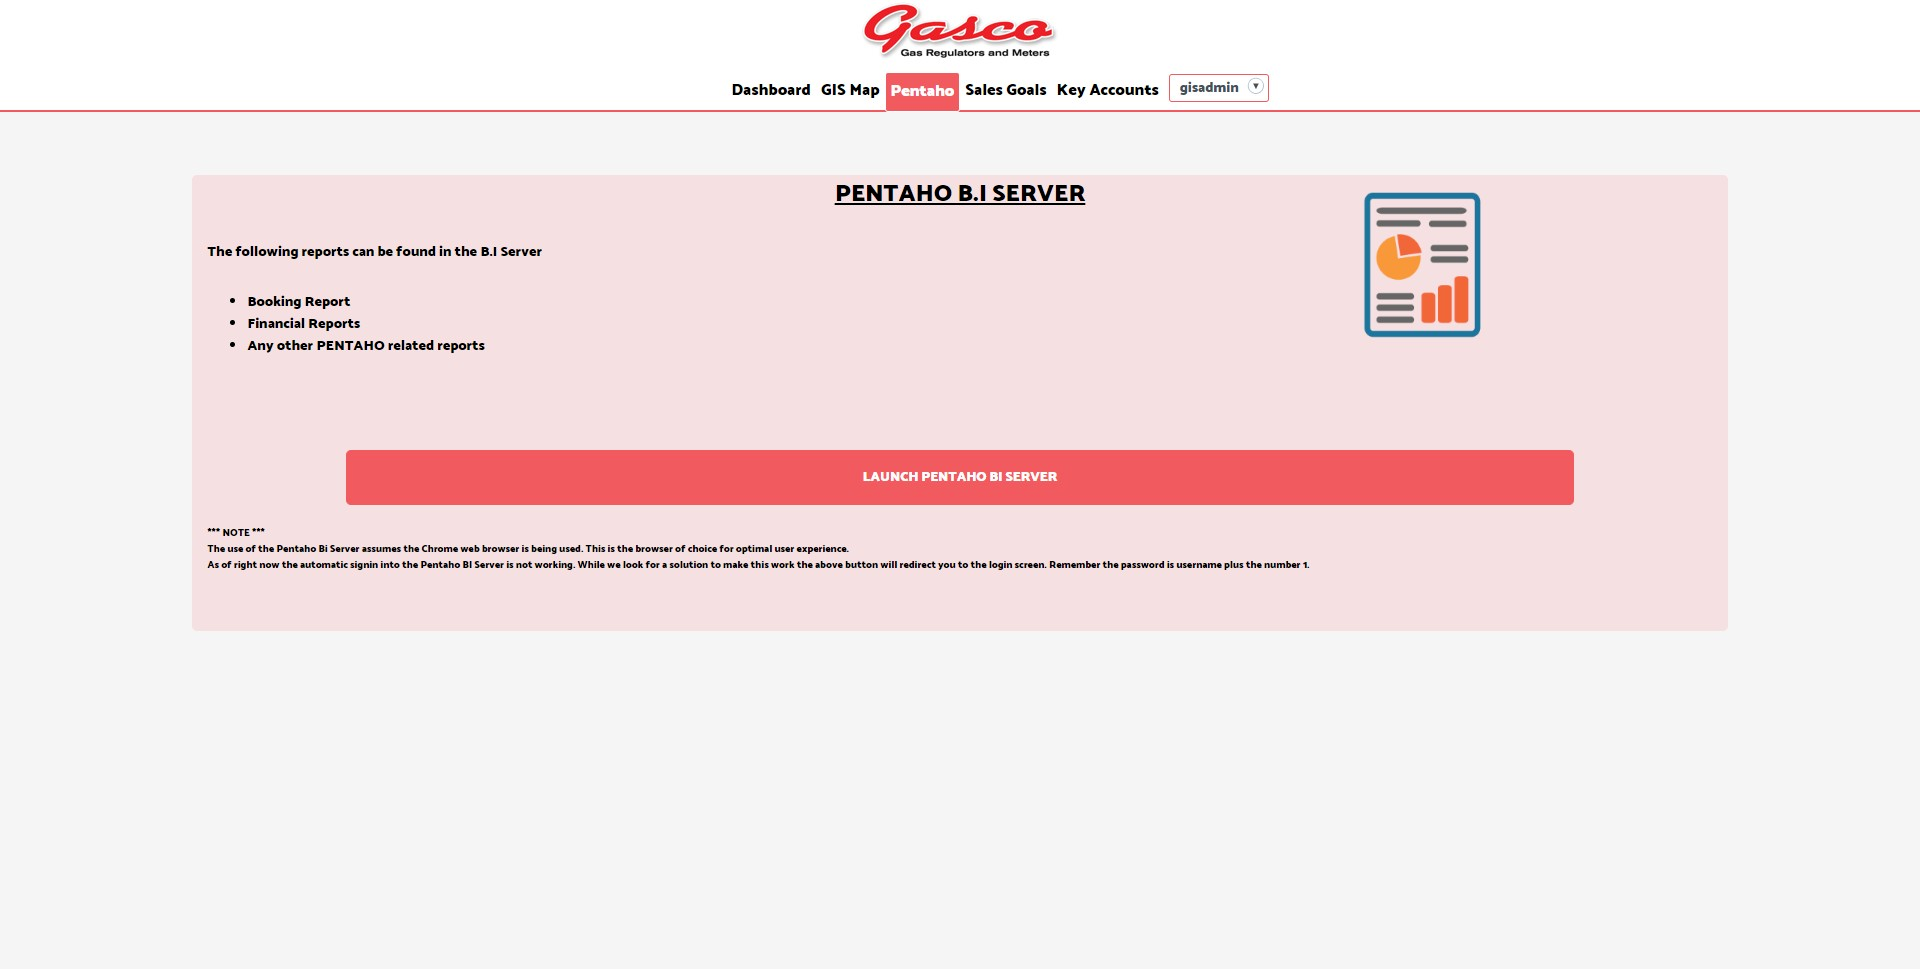
Pentaho Page
This page provides an on-click link to Pentaho reports that are ran and hosted on the Pentaho Bi Server. I also had the task of creating and designing most of those reports(which included financial reports and an inclusive revenue and margin report that leveraged the company's ERP system workflow).